
The  Mediterranean is a unique biodiversity hotspot and tourist destination. One third of all tourists worldwide visit the Mediterranean region every year. Unsustainable consumption and development trends, however, threaten the ecological assets that are the Mediterranean region’s most valuable sources of strength.
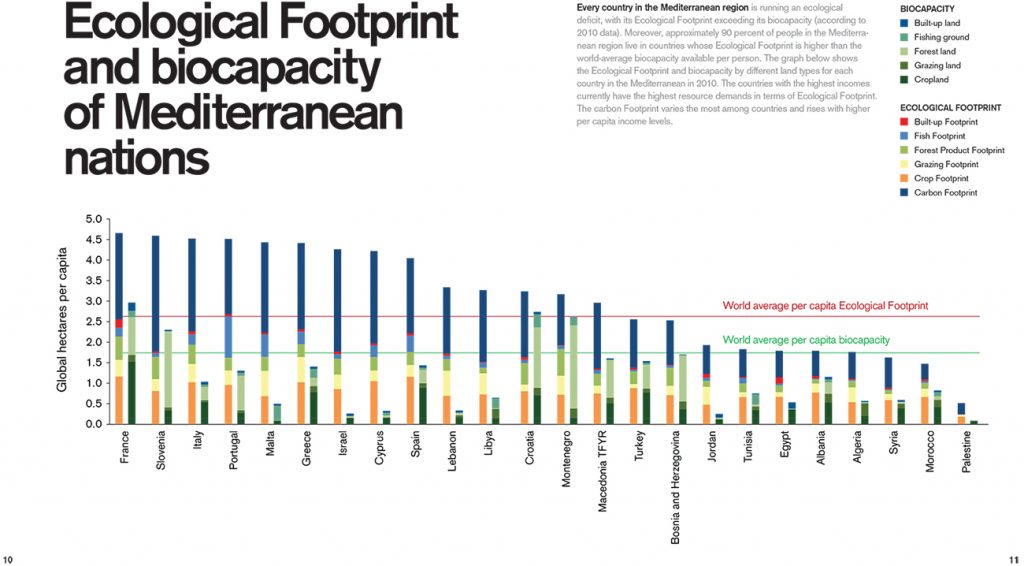
Overall, the Mediterranean region is using approximately 2.5 times more renewable resources than its ecosystems can provide, according to a new study by Global Footprint Network, titled “How can Mediterranean societies thrive in an era of decreasing resources?” In addition, no country in the Mediterranean region meets two key minimum conditions for global sustainable development: living within the planet’s resource budget and satisfactory well-being for its residents, according to the study.
Highlights from the study include:
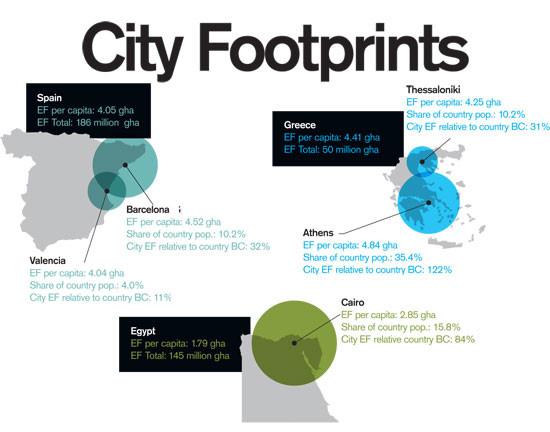
- In analysis of 12 Mediterranean cities, Cairo has the highest total Ecological Footprint, followed by Barcelona and Rome. Residents of Cairo (about 16% of the country’s population) demand about 85 percent of the overall country’s biocapacity.
- The Mediterranean cities with the highest Ecological Footprint per person are Genoa, Athens, and Rome.
- The Mediterranean cities with the lowest Ecological Footprint per person are Antalya, Cairo, and Izmir.
- The demand for renewable resources in Athens exceeds the entire nation of Greece’s supply of resources by 22 percent, although the city’s population comprises about a third of the nation’s population. Transportation is the single most important Footprint driver in Athens, alone demanding approximately 36 percent of the country’s biocapacity. Municipal transportation policies in Athens could thus likely lead to a noticeable reduction in the Ecological Footprint of Greece.
Food Footprint
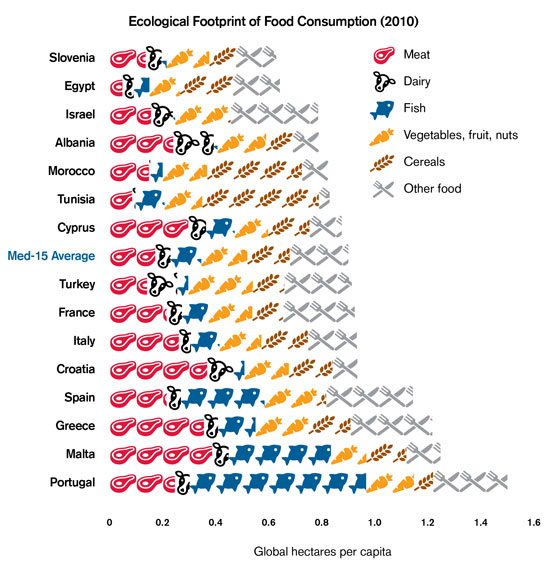
The food sector is the biggest driver of the Ecological Footprint in the Mediterranean region, at about 35% of its overall Ecological Footprint. This poses a specific challenge because food consumption can only be shifted (increased or decreased) to a small extent, given that food is a basic human need.
The average Food Footprint of a Mediterranean resident is approximately 0.9 gha per person, with a range from 0.6 gha to 1.5 gha. That is than the Food Footprints of such countries as India (0.4), China (0.5), Costa Rica (0.6 gha) and Germany (0.8 gha).
The reasons for the Mediterranean region’s relatively high food Footprint include water scarcity, low agricultural productivity, growing dependence on imported food, and a transition away from the traditional environmentally friendly and healthy Mediterranean diet. Instead of consuming cereals, vegetables and oil typical of the Mediterranean diet—which have a low Footprint—countries are consuming more meat and dairy, which have higher Footprints.
Agriculture productivity improvements, food waste reduction, and the promotion of healthier and less protein-based diets thus represent Footprint reduction opportunities for the region.
About the Mediterranean Initiative
Global Footprint Network’s Mediterranean Initiative, launched in June 2010 with the support of MAVA Foundation and in partnership with Plan Bleu, WWF’s Mediterranean Programme, and UNESCO’s Venice Office, aims to bring leaders together to develop a regional approach to managing resource consumption and availability. Our goal is to improve the lives of the region’s residents by incorporating resource constraints into decision-making to ensure the region is both ecologically and economically sustainable.
Additional Resources
Download the report in English, French, or Arabic
Read the press release in English
Ecological Wealth of Mediterranean Countries
[raw_html_snippet id=”med_report”]
Note: Ecological Footprint and biocapacity data is expressed in global hectares per person and refers to year 2010.