MRIO Assessments
Take a deeper look into national and local Footprints using our Multi-Regional Input Output assessments.What is MRIO?
Multi-Regional Input Output modeling is an economic approach which track financial flows between countries’ major economic sectors. MRIO approaches can be extended from financial flows to estimate resource flows by incorporating data from the National Footprint and Biocapacity Accounts. The MRIO-based Footprint data allows us to track detailed resource flows between countries’ major economic sectors to further sub-categorize national Footprint data into more specific consumption and industry related components.
What do we offer?
The MRIO-based Footprint data allows us to understand the flow of resources through the global supply chain. This data can be analyzed from multiple angles making MRIO analyses powerful tools for research and policy assessments. We offer three main analyses:
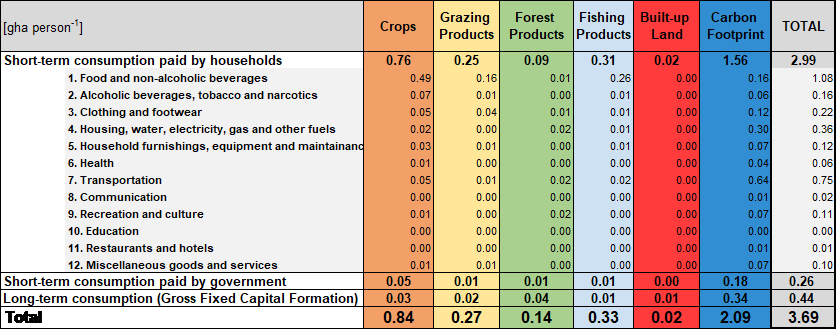
- Consumption-Land-Use Matrix (CLUM)—CLUMs provide a breakdown of a country’s consumption Footprint into its components following the UN COICOP classification. The CLUM is the base dataset used in all top-down subnational Ecological Footprint assessments including city Footprints and personal Footprint Calculators. Each consumption category can also be divided into three dimensions:
- Short-lived consumption directly paid for by households (like bread or clothes),
- Short lived consumption directly paid for by government (like milk distributed in schools or electricity for street lighting), or
- Long-lasting consumption (houses, roads, machines, also called gross fixed capital formation).
- Sector intensities—Each sector produces a specific set of products and services. This analysis estimates how much Footprint it takes, on average, per dollar of value generation (“Footprint intensity per dollar value-add”). This can be compared across other sectors or the same sector in different countries. It can also be benchmarked against global biocapacity/global GDP, or with a country’s biocapacity/country’s GDP to determine a country or sector’s resource efficiency.
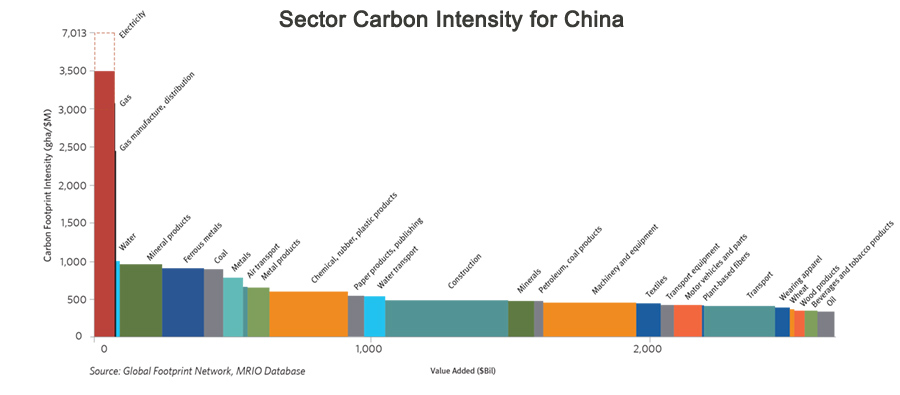
Figure from Burns, S., Alexeyev, J., Kelly, R., Lin, D., Carbon Disclosure and Climate Risk in Sovereign Bonds, 2016. - Trade analyses—Trade data includes country of origin, country of final destination, direct cross-border import and export flows, and allows researchers to track global supply chains. For example, see the analysis we produced on Asian (ASEAN) countries.
How is MRIO produced?
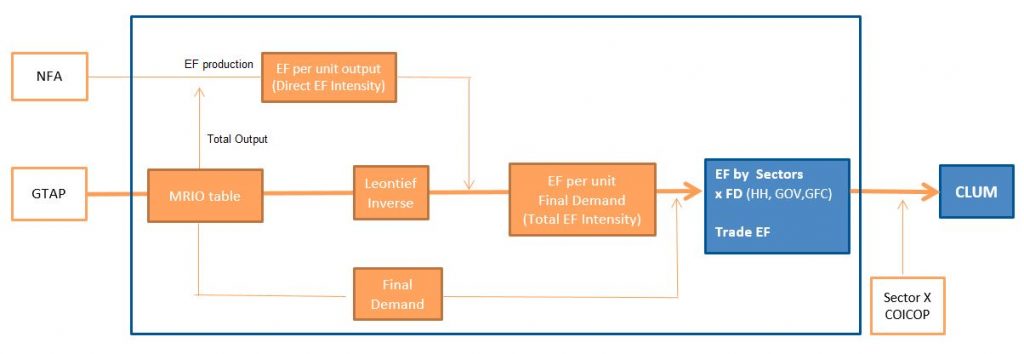
MRIO-based Footprint assessments require two input data sets: the National Footprint and Biocapacity Accounts; and the Global Trade Analysis Project (GTAP) database. GTAP is a widely used financial input-output database maintained by Purdue University. It provides data on purchases between 65 economic sectors and 3 final consumer types in 121 countries and 20 country groups or “regions.” Because the Footprint Accounts are biophysical, and GTAP data is financial, the MRIO-based Footprint assessments apply prices from GTAP to estimate the associated resource flows (expressed as “embodied biocapacity”).
Using these two data sets, an “Input Output” analysis is performed, an approach pioneered by economist Wassily Leontief, and initially brought to life in the 1950s. Essentially, it is linear algebra, and it is data and calculation intensive. The figure below shows the process for producing MRIO-based Footprint results.
Global Footprint Network produces MRIO-based Footprint assessments for all available countries in the National Footprint and Biocapacity Accounts for the base years 2004, 2007, 2011, 2014. These are the years provided by the GTAP MRIO dataset. Currently, we use GTAP version 10.
How do you obtain MRIO data?
Because each output requires not only the initial processing, but also additional quality control, we sell the results to help finance the analytical work. Please contact us for availability and prices of MRIO and CLUM results.
Global Footprint Network provides support for people who license MRIO data (CLUM, trade data, etc.) to better understand potential quality issues with the results, as described below, and how to manage them.
What are the limitations of MRIO assessments?
In general, MRIO-based assessments can provide more detail in consumption categories and economic sectors, but they also introduce an additional level of abstraction. Therefore, the following three limitations need to be considered.
- All limitations of the National Footprint and Biocapacity Accounts and GTAP data apply because they are the inputs for the MRIO assessment.
- The assumption of homogeneity—meaning the supposition that biocapacity intensity in each sector is the same for each dollar. This is a simplification since, for example, a coffee sold for a dollar at a gas station has a different resource intensity than one dollar of gasoline.
- Classification issues with how the economy is split into 65 sectors. Some of these splits may be arbitrary, or too crude, thereby blurring how the economy truly operates.
The resolution of MRIO assessments is limited to the number of sectors. Anything more detailed requires additional data and deeper analysis. The National Footprint and Biocapacity Accounts have continuous time series from 1961 onwards, while GTAP data are limited to four years (2004, 2007, 2011, 2014).
Where can I learn more?
Galli, A., Iha, K., Pires, S. M., Mancini, M. S., Alves, A., Zokai, G., Lin, D., Murthy, A., Wackernagel, M., 2020. Assessing the Ecological Footprint and biocapacity of Portuguese cities: Critical results for environmental awareness and local management. Cities, 96, 102442. (Open Access)
Galli, A., Iha, K., Halle, M., El Bilali, H., Grunewald, N., Eaton, D., Capone, R., Debs, P., Bottalico, F. 2017. Mediterranean countries’ food consumption and sourcing patterns: An Ecological Footprint viewpoint. Science of the Total Environment, 578, 383–391. (Open Access)
Iha, K., Poblete, P., Panda, D., Winkler, S., 2015. A Footprint Analysis of ASEAN: Ensuring Sustainable Development in an Increasingly Resource Constrained World. Asian Biotechnology and Development Review, 17, 57-67. (Restricted Access)
Zokai, Golnar, Jason Ortego, David Zimmerman, Mathis Wackernagel, 2015. The Footprint and Biocapacity of Ontario, Canada: Comparing Results for 2005 and 2010, March 2015, Produced for the Ontario Ministry of Natural Resources and Forestry, Global Footprint Network, Oakland, CA. (Open Access)