
What is the Ecological Footprint of pot? Global Footprint Network tackled that question recently in an analysis of the Ecological Footprint of medical cannabis production in three locations—Colombia, Washington, and Colorado—for PharmaCielo, a Colombian medical cannabis producer headquartered in Canada.
“Mapping the Ecological Footprint of current and planned operations provides PharmaCielo with the ability to quantify overall resource demands of all stages of the cannabis cultivation and production life cycle, including waste production and management, nutrient use, energy consumption, water use, byproducts, etc. against alternative growth and production methods,” said PharmaCielo President and CEO Dr. Patricio Stocker at the launch of the project. “We know that Colombia provides one of the most naturally efficient environments in the world for cultivation, and this process will allow us to put proven accounting measures in place that validate PharmaCielo’s benefits to the global marketplace.”
Indeed, Global Footprint Network’s analysis showed that producing one kilogram of dried cannabis flower per year in an open greenhouse in Colombia has a far lower Ecological Footprint than production at sites in Colorado and Washington. The assessment found such production in Colombia takes about 10 global square metres of biologically productive space. (A global square metre is a square meter with world average biological productivity.) About one sixth is occupied by the direct use of space to grow the plants. The rest is needed to provide inputs such as energy, nutrients, building materials, and water.
In contrast, the closed, artificially lit warehouses in Colorado require 3,700 square metres of biologically productive space to produce one kilogram of dried cannabis flower per year. The warehouse uses about the same direct area for growing plants as the open greenhouse. But the warehouse is far more input dependent, with electricity making up the bulk of this Footprint. Most of the energy is required for lighting.
Because much of the electricity comes from coal power, the area needed to sequester that extra carbon dioxide from electricity production puts a high demand on the biosphere. It makes the warehouse Footprint nearly 400 times larger than that of the greenhouse product. (In 2015, 60% of electricity generated in Colorado came from coal, according to the US Energy Information Administration.)
The analysis also included a third site: greenhouse production in Washington State with very limited artificial lighting and mechanical ventilation. While taking advantage of sunlight, the Washington facility boosts production with some extra light and ventilation support. The assessment concluded that this production method takes nearly 80 global square metres of biologically productive space to produce one kilogram of dry cannabis flower product per year. (More than three-fourths of Washington’s electricity generation originates from renewable resources, predominantly hydroelectric power, according to the US EIA.)
Compared to the other two examples, the Washington state production has relatively high use of access surfaces, leading to a larger direct crop Footprint than the other two operations. But compared to the indoor production, the energy consumption is dramatically lower. Still, the energy consumption represents over half of the production’s demand on biocapacity.
“With the global cannabis industry still in its infancy, now is the essential time for the world to consider its resource demand and environmental impact. We needed this Ecological Footprint study as there had not been any comprehensive assessment of the industry and its possible production techniques before,” said Stocker of PharmaCielo. “With this analysis, we can now much better assess risks and opportunities of different production methods, and anticipate where we need to go rather than react to challenges we ignored.”
The figure below provides a graphical comparison of the largest and smallest Footprint per unit of production. The difference is so large that on the graph, the size of the larger field can only be inferred through its proportions, as it exceeds the graphical space and dwarfs the smallest Footprint option—open greenhouse production in Colombia.
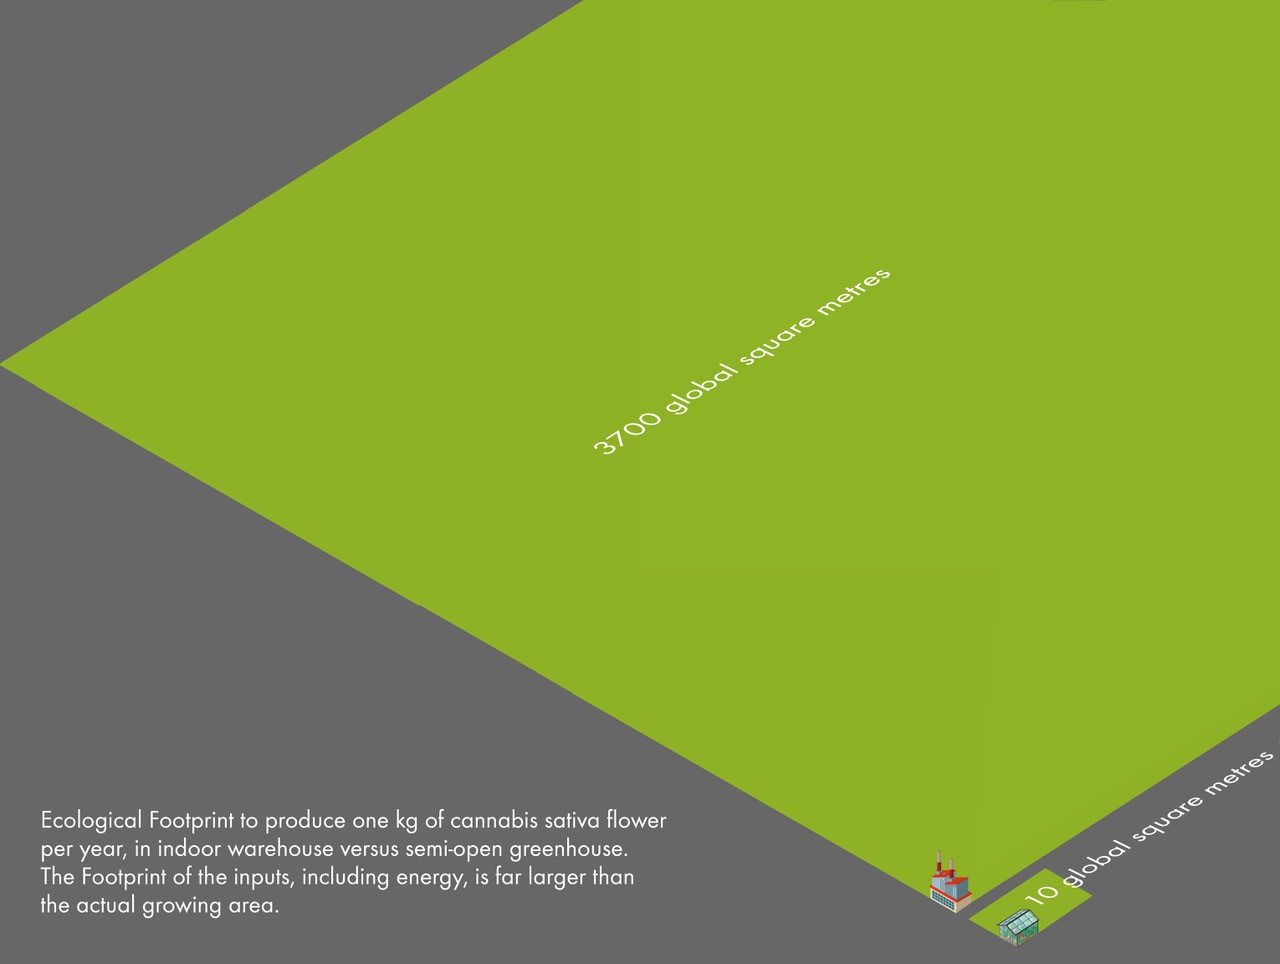
Open greenhouse (Colombia) versus indoor warehouse production (Colorado) per annual kg of dry cannabis sativa flower. Assume that the larger field has the same proportions as the smaller field to get a sense how much bigger the Ecological Footprint demand of the warehouse production is compared to the open field production. But even for the open greenhouse production, demands for additional inputs exceed by one order of magnitude the direct use of space for growing.