This factsheet provides key data about Switzerland’s ecological performance, based on the National Footprint and Biocapacity Accounts.
This is how these accounts work: human activities compete for nature’s regeneration. Regeneration refers to the ability of ecosystems to constantly renew what is being used or damaged. Examples of human demands are food, timber, fibers for clothes, paper, sequestration for CO2 from fossil fuel burning, or space for roads and houses. Therefore, the world or a country is like a farm: it is possible to assess how much is being regenerated and compare it to how much people demand from the farm.
Biocapacity refers to photosynthetic regeneration by ecosystems. This regeneration is driven by the sun and enables life on our planet. Regeneration produces resources and absorbs waste materials. Regeneration provided by ecosystems is one of humanity’s most critical physical inputs, as it is foundation of all food chains on the planet, including all value chains of the human economy. Ecosystems’ regeneration (i.e., biocapacity) can be compared to human demand on regeneration (i.e., their Ecological Footprint).
If a country’s Footprint exceeds its biocapacity, it runs a biocapacity deficit. Some of the deficit can come from importing more resources than the country exports, including the embodied resources in products and services. Some of it can come from overuse (or overshoot). Since biological production typically go through yearly cycles, annual regeneration can be seen as “nature’s budget”. The Footprint then tells us how quickly this budget is exhausted. That date we call the country’s deficit day.
We determine all countries’ deficit (and overshoot) days on December 31st of the year prior, using the latest available edition of the National Footprint and Biocapacity Accounts at that time. For 2023, we therefore used the 2022 edition of the accounts. They feature Ecological Footprint and biocapacity data from 1961 to 2018. Typically, there is a three to four-year lag between the latest data-year and the present due to the UN’s reporting process.
Swiss Deficit Day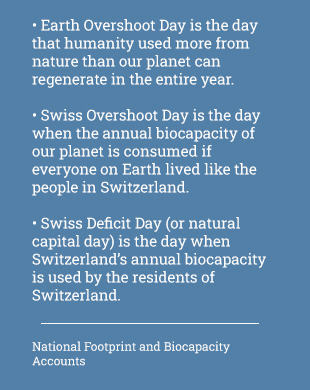
By comparing the biocapacity of a country to its residents’ ecological footprint, we can calculate how quickly the country’s biocapacity budget is spent by the country’s population.
Based on the latest available data, Switzerland contains about 0.99 global hectare of biocapacity per person in the latest available year (2018), while their footprint was 4.3 gha per person. With demand amounting to over 4.4-fold the amount of biocapacity found in Switzerland, this means that the country’s biocapacity budget is exhausted in less than 1/4th of the year, i.e., after 83 days.
This is calculated like this:
(Swiss biocapacity / Swiss Footprint) * 365 days = 83 days
This makes the Swiss Deficit Day for 2023 March 25th. If the residents’ ecological footprint is bigger than the country’s biocapacity, the country demands more from nature than its own ecosystems can provide.
Swiss Overshoot Day
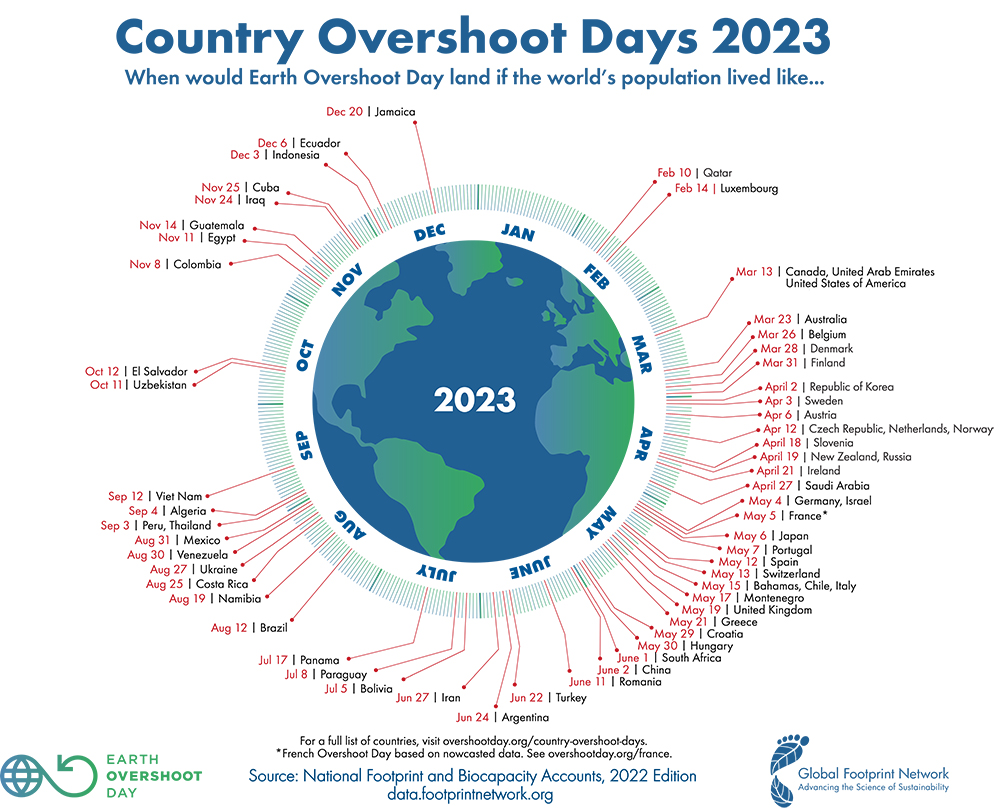
Swiss Overshoot Day is the day when the annual biocapacity of our planet is consumed if everyone on Earth lived like the Swiss (May 13 in 2023).
Since the world has more biocapacity per person than Switzerland, the overshoot day is later than the deficit day. In fact, if everyone in the world consumed like the residents of Switzerland, humanity would be using the equivalent of 2.8 Earths.
This is how we calculate the overshoot day for Switzerland (in 2023). For that we are using the 2022 edition with data for 2018:
- The Ecological Footprint for Switzerland is 4.35 gha per person (in 2018)
- Global biocapacity is 1.58 gha per person (in 2018)
Therefore, it would take (4.35 / 1.58) = 2.8 Earths if everyone lived like the Swiss,
OR
we can determine Switzerland’s overshoot day as 365 * (1.58/4.35) = 133rd day in the year. The 133rd day of 2023 is the 13th of May.
Biocapacity of Switzerland
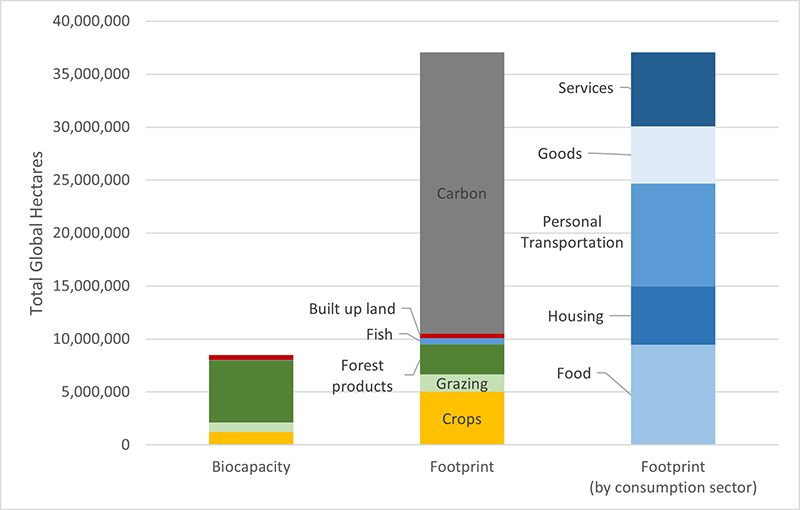
Between 1961 and 2018, Switzerland’s total biocapacity has remained close to constant but has decreased by 28% in per-capita terms (figure 1), as population increased by about 59% in the same time frame. At 0.99 global hectares/per capita, its domestic biocapacity is approximately two-thirds of the global biocapacity available per capita, reflecting Switzerland’s relatively high population density. The biocapacity of Switzerland is mainly composed of forests, followed by cropland and grazing land (figure 2).
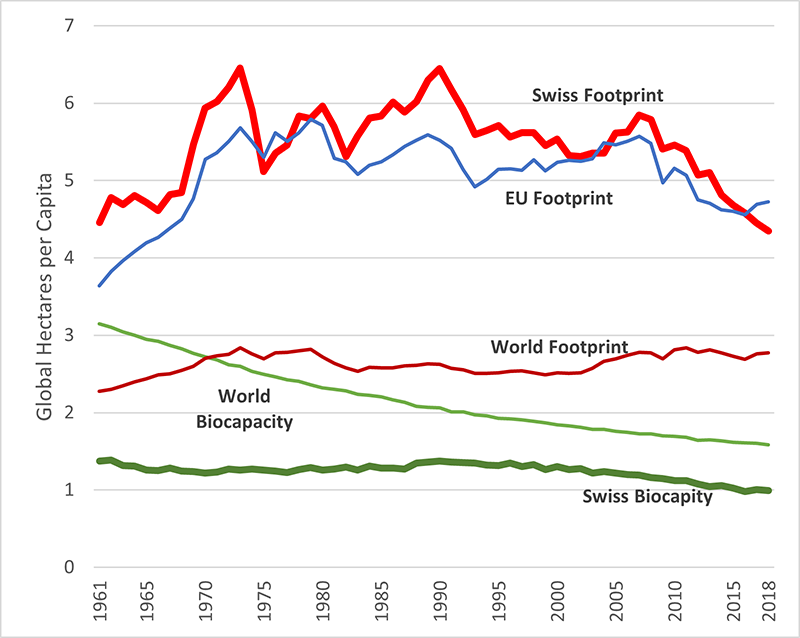
Figure 1: Biocapacity and ecological footprint per person of Switzerland, the EU and the world (1961-2018), 2022 edition of the National Footprint and Biocapacity Accounts
Ecological footprint of Switzerland
After the financial crisis in 2008, the Swiss consumption footprint per capita has begun to decline slowly, after almost four decades at a persistently high level. A big portion of that is due to decarbonization efforts. Nevertheless, it remains higher than in all other regions of the world except for North America and the Arab Gulf.
- Only 23% of Switzerland’s overall consumption footprint could be satisfied by domestic biocapacity in 2018. The remainder is embodied in the net-imports of food and goods (i.e., this consumption is satisfied by the biocapacity of other countries), the use of ecological services from the global commons, i.e., satisfied by a biocapacity that is not counted as part of any country (international fisheries, emissions of CO2from fossil fuel burning) and through depletion of domestic ecosystems.
- The carbon footprint of Switzerland in 2018 was 79 million tons of CO2equivalents for that year (excluding emissions from aviation and international shipping) and accounts for 72% of the ecological footprint. The carbon footprint of its residents corresponds to 3.1 times Switzerland’s biocapacity.
- 31% of the Swiss consumption footprint directly purchased by households is associated with personal transportation, followed by food (23%), services (17%), housing (16%), and goods (14%). This means food and mobility each occupy on their own as much biocapacity as the whole of Switzerland contains.
- The footprint of Swiss food consumption is dominated by meat, which makes up 22% of the food footprint. This is followed by fruit and vegetables (14% each), and Eggs & Dairy (10%). The remainder of the footprint is made up of all remaining categories, which include cereals, oils, sugars & confectionary, and beverages.
- Only 40% of the Switzerland’s food consumption footprint is the result of domestic production, while 60% is met through imports. Of the latter, 10% is imported from Germany, 8% from France, 5% from Italy and 4% from Spain.
If Switzerland halved its CO2-emissions (from 1990 levels), it could move Swiss Overshoot day by 72 days. This assessment is based on assumptions about external carbon intensities as well, since about 84% of the Swiss Carbon Footprint is imported. If Switzerland reaches it’s target (50% reduction of 1990 level) and globally we reach the target of 45% reduction of 2010 levels (Paris Agreement Goal), then Switzerland moved its date by 72 days. This also assumes that global biocapacity per capita is unchanged, and that the CO2 emissions associated with imported emissions are reduced on average by the same as global emissions reduction target calls for.
All these assessments build on the 2022 edition of the National Footprint and Biocapacity Accounts enhanced by Multi-Regional Input-Output assessments. The National Footprint and Biocapacity Accounts are based on about 15,000 data points from United Nations statistics, per country and year. These accounts are continuously maintained by York University, Toronto, under the governance of Footprint Data Foundation (FoDaFo) (www.fodafo.org). Global Footprint Network participates in the governance of FoDaFo. The numbers used here for Switzerland are mostly 2018 numbers. However, because of limited data quality, figures for fishing grounds footprint are estimated based on historic data.
 Choose format to view/download:
jpg | PDF
Resources
- Country-level Footprint data platform with results for Switzerland and other countries around the world
- Basic introduction to the Ecological Footprint and biocapacity concepts
- Ecological Footprint and biocapacity data downloads and licenses
- Swiss Overshoot Day 2023 Press release
- Swiss Deficit Day 2023: Press Release in English, French, and German
- Swiss Overshoot Day 2022 Press release
- Description of the National Footprint and Biocapacity Accounts accounting methodology
- Wackernagel, M., Hanscom, L., Jayasinghe, P., Lin, D., Murthy, A., Neill, E., Raven, P., 2021. The importance of resource security for poverty eradication. Nature Sustainability. 4, pages 731–738 (2021).