In 2015, the Ecological Deficit Day of the United States landed on July 14, according to our new report, “State of the States: A New Perspective on the Wealth of Our Nation,” co-authored by Earth Economics.
A Twitter chat on the report was hosted on July 14, 2015, at #USAfootprint. To view the Twitter chat, go here.
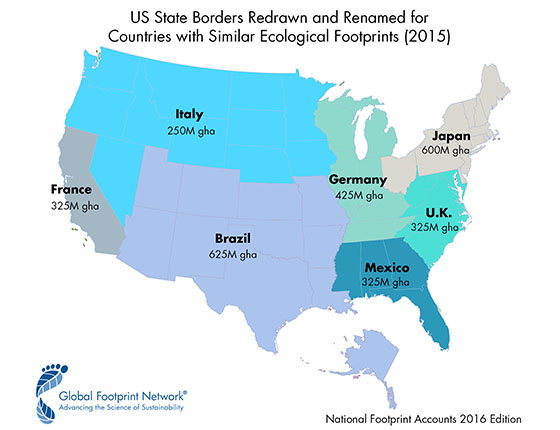
“State of the States” details the Ecological Footprint and resource availability of the 50 states and the District of Columbia. The report finds that resource consumption and availability varies dramatically state by state.
Highlights from the report include:
- The population of the United States is using twice the renewable natural resources and services that can be regenerated within its borders.
- The states with the largest per-person Ecological Footprints are Virginia, Maryland, and Delaware.
- The states with the smallest per-person Ecological Footprints are New York, Idaho, and Arkansas.
- Alaska, Texas, and Michigan are the most resource-abundant states based on biocapacity, a measure of bioproductive land.
- The states with the least biocapacity are Rhode Island, Delaware, and Arizona.
- California, Texas, and Florida have the highest ecological deficits.
- Alaska, South Dakota, and Montana have the greatest ecological reserves.
Additional Resources
Press Release: Today is the Ecological Deficit Day for the United States
Ecological Wealth of the 50 States
| State | Population | Gross Domestic Product, 2014 | Life Expectancy at Birth | Human Development Index | Carbon Footprint | Non-carbon Footprint | Total Ecological Footprint | Biocapacity |
|---|---|---|---|---|---|---|---|---|
| (millions) | (chained 2009 dollars per capita) | (years) | (global acres per person) | (global acres per person) | (global acres per person) | (global acres per person) | ||
| 310,384,000 | 49,469 | 78.9 | 5.03 | 11.5 | 5.7 | 17.2 | 9.3 | |
| 4,779,736 | 37,593 | 75.4 | 4.04 | 11.2 | 5.1 | 16.3 | 14.8Ala | |
| 710,231 | 66,160 | 78.3 | 5.06 | 13.1 | 6.2 | 19.2 | 510.9 | |
| 6,392,017 | 38,743 | 79.6 | 4.89 | 10.3 | 5.4 | 15.8 | 1.1 | |
| 2,915,918 | 37,334 | 76.0 | 3.91 | 10.6 | 4.8 | 15.4 | 24.8 | |
| 37,253,956 | 54,462 | 80.8 | 5.40 | 10.5 | 6.0 | 16.5 | 1.9 | |
| 5,029,196 | 52,214 | 80.0 | 5.53 | 13.4 | 6.6 | 20.0 | 5.8 | |
| 3,574,097 | 64,676 | 80.8 | 6.17 | 13.7 | 7.8 | 21.5 | 2.0 | |
| 897,934 | 60,551 | 78.4 | 5.22 | 16.6 | 6.8 | 23.4 | 3.4 | |
| 601,723 | 159,386 | 76.5 | 6.08 | 15.8 | 6.3 | 22.0 | 0.2 | |
| 18,801,310 | 38,690 | 79.4 | 4.82 | 10.9 | 5.2 | 16.0 | 4.6 | |
| 9,687,653 | 43,131 | 77.2 | 4.62 | 11.6 | 5.4 | 17.0 | 8.2 | |
| 1,360,301 | 49,686 | 81.3 | 5.53 | 11.3 | 5.8 | 17.1 | - | |
| 1,567,582 | 35,235 | 79.5 | 4.50 | 9.5 | 5.8 | 15.3 | 17.0 | |
| 12,830,632 | 52,827 | 79.0 | 5.31 | 11.3 | 5.8 | 17.2 | 5.9 | |
| 6,483,802 | 43,861 | 77.6 | 4.56 | 13.1 | 6.0 | 19.1 | 7.7 | |
| 3,046,355 | 49,075 | 79.7 | 5.03 | 13.9 | 6.6 | 20.5 | 21.0 | |
| 2,853,118 | 45,765 | 78.7 | 4.96 | 13.1 | 6.0 | 19.1 | 26.2 | |
| 4,339,367 | 38,938 | 76.0 | 4.02 | 14.2 | 5.3 | 19.5 | 13.9 | |
| 4,533,372 | 46,448 | 75.7 | 4.12 | 12.0 | 5.3 | 17.3 | 13.1 | |
| 1,328,361 | 38,327 | 79.2 | 4.93 | 10.1 | 5.7 | 15.8 | 30.5 | |
| 5,773,552 | 53,759 | 78.8 | 5.94 | 16.9 | 7.4 | 24.3 | 2.5 | |
| 6,547,629 | 63,005 | 80.5 | 6.16 | 12.0 | 6.6 | 18.6 | 1.7 | |
| 9,883,640 | 42,110 | 78.2 | 4.76 | 11.2 | 5.5 | 16.6 | 11.8 | |
| 5,303,925 | 52,801 | 81.1 | 5.69 | 12.4 | 6.4 | 18.8 | 16.9 | |
| 2,967,297 | 31,551 | 75.0 | 3.81 | 10.7 | 4.9 | 15.6 | 21.7 | |
| 5,988,927 | 42,854 | 77.5 | 4.60 | 13.4 | 6.1 | 19.5 | 16.2 | |
| 989,415 | 38,539 | 78.5 | 4.54 | 10.9 | 5.2 | 16.1 | 54.3 | |
| 1,826,341 | 52,724 | 79.8 | 5.11 | 13.5 | 6.7 | 20.3 | 38.1 | |
| 2,700,551 | 42,539 | 78.1 | 4.63 | 11.8 | 6.4 | 18.2 | 4.1 | |
| 1,316,470 | 49,951 | 80.3 | 5.73 | 13.6 | 7.8 | 21.4 | 8.8 | |
| 8,791,894 | 56,405 | 80.3 | 6.12 | 11.9 | 6.8 | 18.7 | 1.3 | |
| 2,059,179 | 40,081 | 78.4 | 4.52 | 11.3 | 5.5 | 16.8 | 11.9 | |
| 19,378,102 | 64,818 | 80.5 | 5.66 | 9.3 | 5.0 | 14.2 | 3.5 | |
| 9,535,483 | 44,281 | 77.8 | 4.57 | 12.2 | 5.4 | 17.6 | 7.6 | |
| 672,591 | 65,225 | 79.5 | 4.90 | 15.2 | 6.7 | 22.0 | 38.5 | |
| 11,536,504 | 45,887 | 77.8 | 4.71 | 12.4 | 5.8 | 18.3 | 5.5 | |
| 3,751,351 | 41,871 | 75.9 | 4.14 | 13.4 | 5.6 | 19.1 | 20.2 | |
| 3,831,074 | 51,329 | 79.5 | 4.86 | 9.8 | 5.9 | 15.7 | 17.4 | |
| 12,702,379 | 47,637 | 78.5 | 5.07 | 10.4 | 5.4 | 15.8 | 4.9 | |
| 1,052,567 | 47,901 | 79.9 | 5.38 | 11.4 | 6.2 | 17.5 | 1.5 | |
| 4,625,364 | 36,125 | 77.0 | 4.35 | 10.7 | 5.2 | 16.0 | 9.3 | |
| 814,180 | 46,688 | 79.5 | 4.79 | 11.2 | 6.1 | 17.3 | 72.3 | |
| 6,346,105 | 42,115 | 76.3 | 4.22 | 11.3 | 5.0 | 16.3 | 9.9 | |
| 25,145,561 | 54,433 | 78.5 | 4.65 | 12.8 | 5.8 | 18.6 | 6.7 | |
| 2,763,885 | 43,555 | 80.2 | 5.03 | 14.8 | 7.1 | 22.0 | 5.0 | |
| 625,741 | 43,354 | 80.5 | 5.31 | 10.2 | 6.5 | 16.7 | 19.5 | |
| 8,001,024 | 51,338 | 79.0 | 5.47 | 17.0 | 7.7 | 24.6 | 7.4 | |
| 6,724,540 | 55,298 | 79.9 | 5.40 | 10.6 | 6.3 | 17.0 | 10.6 | |
| 1,852,994 | 36,769 | 75.4 | 3.95 | 13.9 | 5.3 | 19.2 | 19.4 | |
| 5,686,986 | 46,665 | 80.0 | 5.16 | 12.9 | 6.3 | 19.2 | 14.1 | |
| 563,626 | 64,309 | 78.3 | 4.83 | 13.9 | 6.5 | 20.4 | 39.8 |
Data Table References
Population: 2010 U.S. Census
GDP, 2014: U.S. Bureau of Economic Analysis
Life Expectancy at Birth: Measure of America Human Development Index (HDI) and Supplemental Indicators 2013–2014
Human Development Index: Measure of America Human Development Index (HDI) and Supplemental Indicators 2013–2014. The American HDI is a composite measure of health, education, and income indices.