Thanks to a Twitter prod from a friend, we created this map above comparing the Ecological Footprints of the US states with those of seven countries. (No, the Tweet was not from the most infamous Tweeter in the US today. Read to the end to find out who our Twitter friend is.)
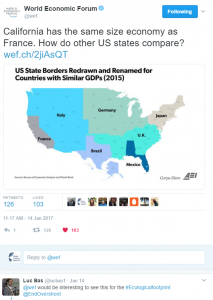
Our map was inspired by a similar one for GDP posted on Twitter by the World Economic Forum (WEF) during its 2017 Annual Meeting in Davos earlier this month. The original graphic was posted by the American Enterprise Institute last year.
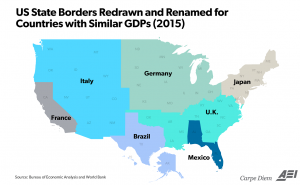
As WEF noted on its blog, seven areas of the US have the same GDP as entire countries. We were very surprised that the Ecological Footprints of these same seven countries also have approximately the same Ecological Footprint of the entire United States, although our map is different from the GDP map in a few striking ways.
First, it’s notable that the total US Ecological Footprint equals that of seven countries that together generate the same GDP as the US. It’s especially remarkable considering that combined populations of these seven countries—approximately 730 million (UN FAO)—is more than double the 320 million people who live in the United States. This reflects the substantially higher average Ecological Footprint per person of Americans compared with other countries. For instance, the Ecological Footprint per person for the US is 8.6 global hectares (gha), more than double Brazil’s Footprint average of 3.1 gha and Mexico’s average of 2.6 gha.
Germany’s Ecological Footprint per person comes closest to that of the United States, and it’s still substantially lower, at 5.3 gha.
In the WEF/American Enterprise map, some US states have GDPs the size of countries. This also holds true for just California and France in the Footprint map.
The maps show that California and France have roughly the same GDP and Footprint. Yet California’s population totals approximately 37 million, compared with France’s 64 million. California, thus, comes out as a more powerful economic engine than France on a per-person basis, but at a cost to sustainability. California’s 2015 per person Footprint, updated from our State of the States report with our latest methodology, totaled 21.2 acres per person, or nearly 8.6 global hectares per person, compared with France’s 4.8 gha.
Meanwhile, Brazil’s GDP equates that of Texas, but its Ecological Footprint expands beyond Texas’ borders on our map to include nine other states. This likely reflects Brazil’s larger population—the two factors that drive Ecological Footprint are consumption and population. Brazil’s population totals 208 million, compared with Texas’ population of 25 million. Here, Texas comes out as the economic powerhouse, while Brazil earns points for lower resource consumption.
Similarly, Mexico’s economy equates that of only two states—Florida and Alabama—while its Ecological Footprint totals the Footprints of those two states plus Georgia and Mississippi.
The situation in Germany is just the opposite. Its economy covers twice as many states on the GDP map as those covered on the Footprint map.
To be sure, the maps can be a bit confusing. The WEF map makes it look like the economy of Italy is bigger than that of France, because Italy covers more states. But those states have smaller economies combined than all of California, one of the 10th largest economies in the world.
And on our Footprint map, it appears Brazil has a much larger Footprint than Japan. Japan’s Footprint and economy maps over the northeastern states, including New York. But in fact, Brazil and Japan have relatively similar total Ecological Footprints—approximately 625 million for Brazil and 600 million for Japan.
Maybe the next step to improve clarity would be to create anamorphic maps in which the size of the states are adjusted to reflect the size of their economies and Ecological Footprints. Anyone up for that challenge?
A special call out to Luc Bas, Director of the Brussels office of the International Union for Conservation of Nature (IUCN), for suggesting we create this map in his Tweet below.