Global Footprint Network launches its 2016 edition of the National Footprint Accounts today, featuring a refined carbon Footprint calculation.
The updated calculation has revealed that the global carbon Footprint is 16 percent higher than previously calculated, with a consequent 8 percent increase in the global Ecological Footprint. The carbon Footprint makes up 60 percent of the world’s Ecological Footprint.
We are happy to make the National Footprint Accounts available in a free downloadable version for research, education and non-commercial purposes (scroll down for more details). An interactive map and country rankings based on the National Footprint Accounts 2016 are available at footprintnetwork.org/maps. Watch a video explaining the National Footprint Accounts here. If you are interested in attending a webinar on the Footprint Accounts, please email media@footprintnetwork.org.
The annual maintenance of the National Footprint Accounts involves incorporating the most recent data (2012) from the United Nations Food and Agriculture Organization (FAO), United Nations Comtrade database, the International Energy Agency (IEA), and other sources.
Carbon Update
As mentioned above, we have made a number of improvements to the accounting methodology this year. The most influential is the new calculation of Average Forest Carbon Sequestration (AFCS) value—which is the long-term capacity for one hectare of world-average forest ecosystem to sequester carbon dioxide. By including new data sources and accounting for multiple forest categories, global wildfires, and forest ecosystem emissions from soil and harvested wood products, forests were found to provide less net-sequestration of carbon than previously calculated.
The Ecological Footprints of countries are impacted by the new methodology. The higher a country’s carbon Footprint as a percentage of its overall Ecological Footprint, the bigger the increase in its Footprint compared to last year’s edition. For instance, Oman, whose carbon Footprint makes up a whopping 77 percent of its Ecological Footprint, has jumped up over 20 places in the ranking of countries that demand more than their own ecosystems can renew. (Oman is now one of the top 15 countries by ecological deficit.) On the other hand, Ethiopia, whose carbon Footprint is a mere 7 percent of its Ecological Footprint, fell 16 slots down the same ranking.
The robust carbon Footprint calculations are especially timely in light of the historic Paris Agreement signed in December 2015 by 195 nations and the European Union. The adopted goal of restricting average temperature increases to 2 degrees Celsius above pre-Industrial Revolution levels translates into a specific upper carbon budget for all future emissions of 800 gigatonnes CO2. The Paris Agreement also shifts the focus to net emissions of countries, recognizing the importance of land-use choices for carbon sequestration. In this context, Ecological Footprint accounts—which measure both emissions on the demand side and the supply of sequestration on the biocapacity side—provide a natural framework to evaluate net emissions by countries and the interaction between competing demands on a country’s land.
Beyond carbon, looking at the world through the prism of the Ecological Footprint makes for interesting insights, revealing long-term trends and impacts regarding countries’ ecological wealth, economic health and population growth. Here are a few highlights:
-
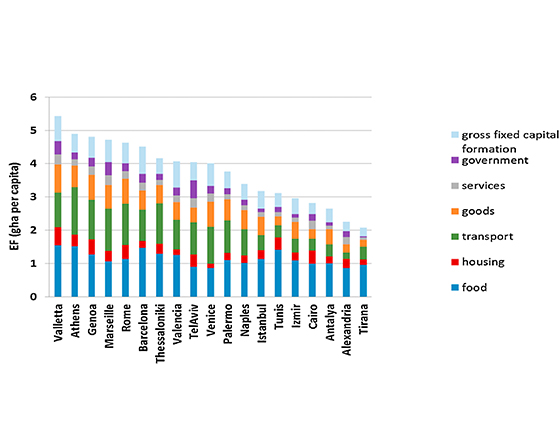
- Southern European countries (Portugal, Italy, Greece, Spain) have been registering a steady decline of their Ecological Footprint per capita since the mid-2000s. By contrast, strong European economies like Germany and France have seen a rebound of their Ecological Footprint per capita since the 2008 financial crisis. What would it take for the Southern European countries to strengthen their economy AND reduce their Ecological Footprint?

-
- Asian countries with rapid economic expansion, such as India, China, South Korea and Vietnam, are displaying a strong increase of their Ecological Footprint per capita that is concomitant with their rising standards of living.Note that Vietnam and Cambodia stand out among Asian countries for their successful efforts building up their biocapacity per person to support their growing Ecological Footprint.

-
- Low-income countries with surging population growth (fast-increasing demand) or violent turmoil (collapse of agricultural activity and output) — including Honduras, Niger and Somalia — are hitting the threshold of their own ecosystems’ ability to support (biocapacity) their population’s demand (Ecological Footprint.)

Curious to explore more? Download our Public Data Package!
Global Footprint Network is offering a free downloadable version of its National Footprint Accounts for research, education and non-commercial purposes, at footprintnetwork.org/public. This Public Data Package includes the latest results for all countries, country graphics and the number of Earths required if the world’s population lived like the average citizen of each country. The free download also offers many new ways to sort data — by region, GDP, Human Development Index and other categories — and data quality scores for the results.
About the National Footprint Accounts
Global Footprint Network’s annual update of the National Footprint Accounts tracks the balance sheet of approximately 200 nations from year to year, based on nearly 15,000 data points per country per year from over 30 sources. The accounts add together a country’s annual demand for the natural resources and ecological services our planet’s lands and seas provide—fruits and vegetables, meat, fish, wood, cotton for clothing, timber and carbon dioxide absorption. This demand, the Ecological Footprint, then can be compared to the supply of these goods and services provided by that country’s ecosystems, called biocapacity.
In 1961, the first year for which consistent data sets are available, our planet was able to supply 37 percent more resources and services than humanity demanded. Since then, the global ecological deficit—the amount by which humanity’s demand has exceeded nature’s budget—has widened substantially. The 2016 edition of the National Footprint Accounts shows that the world population demands 64 percent more than what nature can regenerate in one year through overfishing, over-harvesting our forests and, primarily, emitting more carbon dioxide than our ecosystems can absorb. The effects include wildlife habitat loss and fragmentation, collapsing fisheries, and climate change.
More information about the new carbon calculation in the National Footprint Accounts can be found in the peer-reviewed Ecological Indicators article Ecological Footprint: Refining the carbon Footprint calculation.
For licensing questions about the National Footprint Accounts, contact data@footprintnetwork.org.