
Humanity’s total Ecological Footprint—a measure of global demand for natural resources—remained virtually constant in 2014 compared to 2013, according to new data released by Global Footprint Network today at an event at Oxford University. In another positive sign, the global Ecological Footprint per person actually decreased by 1.1 percent in 2014 compared to 2013. Still humanity’s demand for renewable resources remains 68 percent higher than what the planet can renew.
The levelling of the total global Ecological Footprint in 2014, the latest year with a complete U.N. data set, may be due to a flattening of demand in China combined with slight decreases of the Ecological Footprints in high-income countries. This led to an average per-person Ecological Footprint worldwide of 2.8 global hectares, compared to 1.7 global hectares per person of available biocapacity. (Biocapacity represents the productivity of the Earth’s ecological assets. A global hectare is a biologically productive hectare with world average productivity.)
Eighty-six percent of the world’s population lives in a country with an ecological deficit. A country runs an ecological deficit when its residents demand more from nature than the country’s ecosystems can regenerate. Seventy percent of humanity lives in a country with an ecological deficit and below-average income, and therefore are unlikely to be able to buy themselves out of the resource crunch.
“Clearly, resource security is becoming an ever more significant factor for securing countries’ long-term economic vitality and resilience. Unfortunately, this is still not recognized by mainstream development policy, much to the detriment of low-income populations,” says Dr. Mathis Wackernagel, CEO of Global Footprint Network.
Global Footprint Network launched the National Footprint Accounts 2018 and several new data tools at an event during Skoll Week at Oxford. In addition, Global Footprint Network is presenting its key results on Monday, April 16, at George Washington University in Washington, D.C.
Highlights of the new Footprint data and tools include:
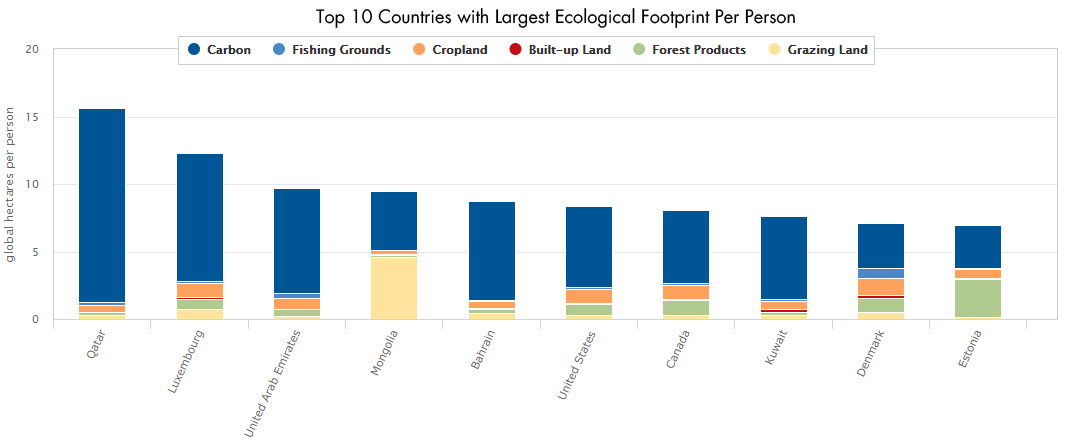
- The National Footprint Accounts 2018 Edition includes time series data for 17 countries that were not provided in the past due to data quality issues. This includes Bahrain, Equatorial Guinea, Qatar, United Arab Emirates, Kuwait, and Kazakhstan.
- Interactive world maps for Footprint and biocapacity at data.footprintnetwork.org.
- Sixty new ways to sort countries on the downloadable Public Data Package, including post-USSR countries, BRICS countries (Brazil, Russia, India, China, South Africa), OPEC countries, countries with the greatest GDP per capita growth from 1997 to 2007, high inflation countries, high population growth countries, and low-income countries facing severe resource constraints.
- Trend graphs for all countries, including for the compositions of the Ecological Footprint.
Additional features available for a fee include “nowcasting” capabilities to forecast results to 2018 and licenses for more detail on countries’ demand by consumption activities.
Human Development
One piece of good news is that quality of life is improving around the world, according to the UN Development Programme. The 2016 Human Development Report (the latest published) found that the U.N. Human Development Index (HDI) improved significantly across all regions from 1990 to 2015. HDI is a composite index based on three components: education, longevity, and income. A score of 0.7 is “high human development.” The graph below shows that as HDI increased, so did the Ecological Footprint per person.
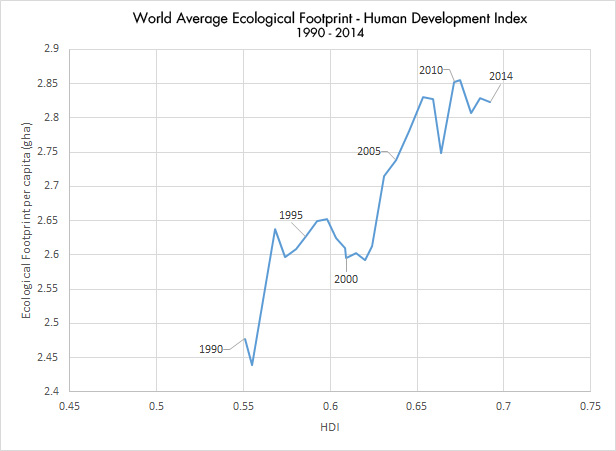
Despite such progress, the 2016 Human Development Report emphasizes that one in three people worldwide continues to live in low levels of human development.
Similarly, Footprint data reveals that ecological pictures vary dramatically country by country.
High-Income Countries
The Ecological Footprint per person for high-income countries has declined 12.9 percent since 2000. Some of the countries with the largest declines since 2000 include Singapore (-32.1 percent), the Bahamas (-26.2 percent), Denmark (-19.0 percent); United States (-18.4 percent), United Kingdom (-16.6 percent), and France (-15.5 percent).
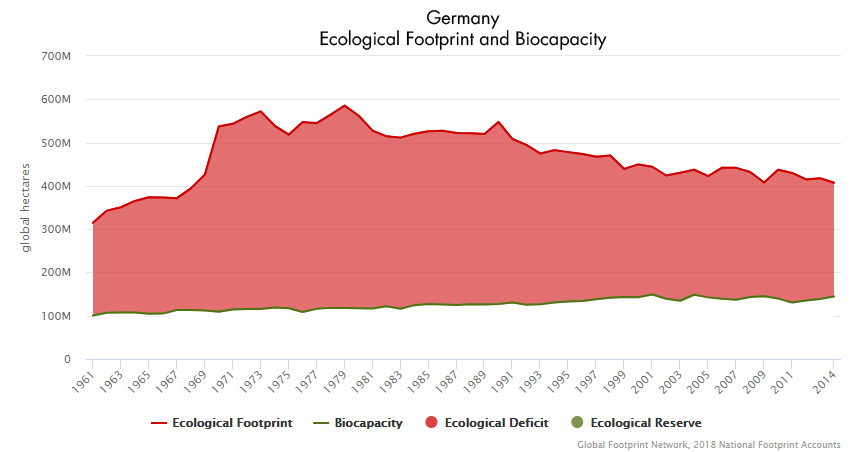
Germany experienced an 8 percent decline in its Ecological Footprint per person since 2000 and a 2.5 percent decline in its Ecological Footprint per person from 2013 to 2014. The carbon component of Germany’s Ecological Footprint declined 6.2 percent from 2013 to 2014.
Only six countries are in the envious position of increasing their ecological reserve: Estonia, Finland, Latvia, Norway, Sweden, and Uruguay.
China Trends
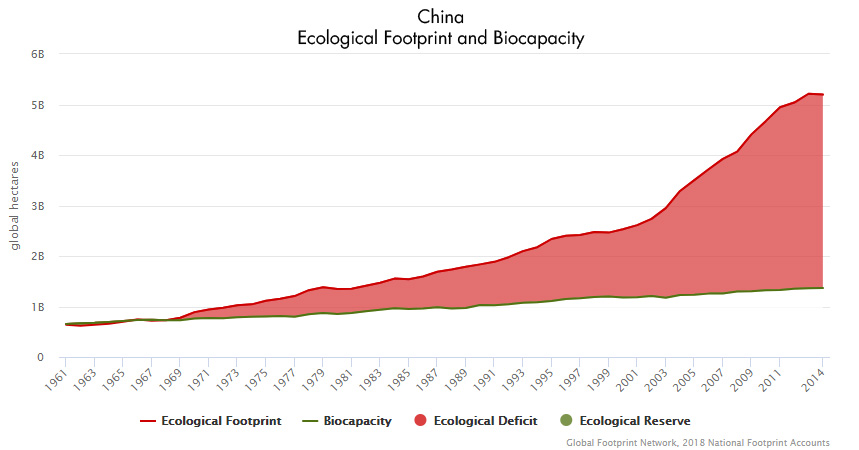
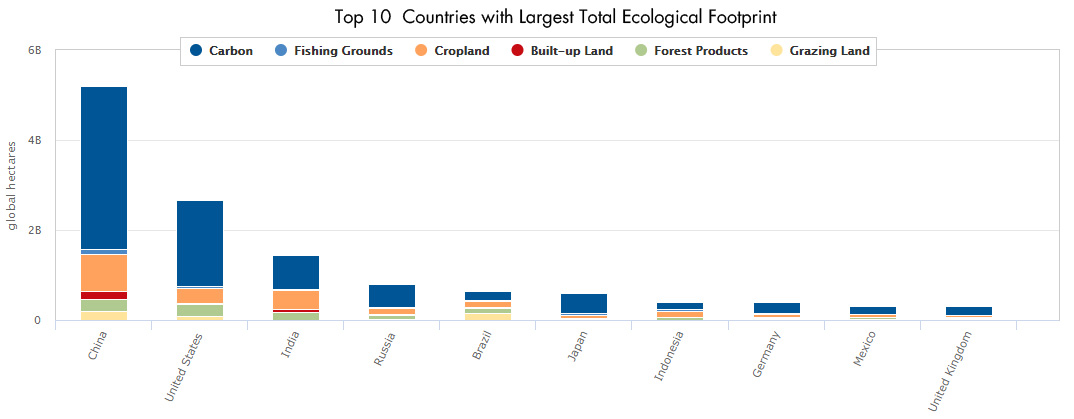
China continues to have the largest total Ecological Footprint of any country—no surprise given its huge population. The unexpected news is that China’s total Footprint actually decreased 0.3 percent from 2013 to 2014 after a steady climb since 2000, when it was half as large as it is today. China’s Ecological Footprint per person also decreased by 0.8 percent from 2013 to 2014. It is the first time these values have decreased since 2000.
The decline stems in part from a decrease in China’s total carbon Footprint by 0.7 percent and its per-person carbon Footprint by 1.2% from 2013 to 2014.
Carbon makes up the biggest portion of the global Ecological Footprint, at 60 percent. The total global carbon Footprint was about the same in 2014 as 2011, hovering at nearly 12.5 billion global hectares. This represents the area needed to sequester the carbon dioxide that the world emits into the atmosphere each year by burning fossil fuel.
Inflection Points
Two countries, both in Africa, became ecological debtors in 2014: Mali and Somalia. Bulgaria was the only country whose ecological budget moved into the black, possibly because of changes in agricultural practices.
Mali and Somalia are among 28 countries highlighted in the Public Data Package’s new sorting feature as “newly at risk,” which means they are either on the verge of running or just starting to run an ecological deficit. Other countries in this category include Botswana, Ecuador, Fiji, Honduras, Indonesia, Laos, and Nicaragua.
Footprints by the Numbers
Additional Resources
Ecological Footprint Explorer Open Data Platform: data.footprintnetwork.org
Public Data package: www.footprintnetwork.org/public
Footprint Calculator: www.footprintcalculator.org
Country Work: www.footprintnetwork.org/countries
National Footprint Accounts Video: https://youtu.be/_T5M3MiPfW4