But the respite may be short-lived,
according to more recent carbon emissions data.
OAKLAND, CALIFORNIA, APRIL 25, 2019—The 2019 edition of the National Footprint and Biocapacity Accounts tracks the Ecological Footprint and biocapacity of all countries, using U.N. data, from 1961 to 2016. This is two years further than last year’s edition, since U.N. data is becoming available more rapidly.
 One finding is that humanity’s carbon Footprint dropped 1.4 percent between 2014 and 2016, bringing the total Ecological Footprint—a measure of global human demand for biological resources—down 0.5 percent over the same period. Recent data pointing to significant increases in carbon emissions throughout 2017 and 2018 suggest that this trend was short-lived, however.
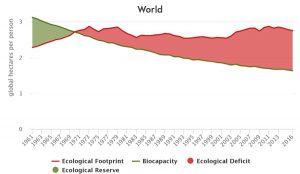
Because carbon emissions require land covered with forests to be absorbed, they are counted as a competing human demand on the planet in the Ecological Footprint accounts. They compete for land area with demands for food, forest products, fibers, or infrastructure needs such as roads and buildings. In fact, the carbon Footprint accounts for 60 percent of the current Ecological Footprint of humanity. Overall, humanity’s demand for goods and services from ecological systems is currently 75 percent higher than what the planet can renew today.
“Our data show that we use as much from nature as if we lived on 1.75 Earths, yet we only have one. This is not a judgement, just a measurement. In this context, bringing human activity back within the ecological budget of our one planet is not about doing the noble thing or easing our guilty conscience. It is about choosing self-interest and what works. We will move out of ecological overshoot. Why choose to get there by disaster rather than by design?” —DR. MATHIS WACKERNAGEL, Founder and President of Global Footprint Network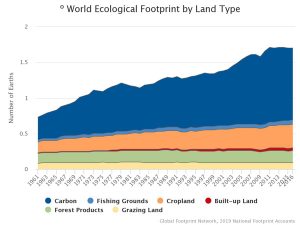
All the Footprint and biocapacity data up to 2016 is freely available on the Ecological Footprint Explorer open data platform at data.footprintnetwork.org. Additionally, “nowcasting” capabilities to forecast results to 2019 and licenses for more detail on countries’ demand by consumer activities are available for a fee.
The shrinking of the total global Ecological Footprint in 2016, the latest year with a complete U.N. data set, is mostly due to a 1.4 percent drop in the carbon Footprint over the 2014-2016 period. This led to an average per-person Ecological Footprint worldwide of 2.8 global hectares (gha), compared to 1.6 gha per person of available biocapacity. (Biocapacity represents the productivity of the Earth’s ecological assets; a global hectare is a biologically productive hectare with world average productivity.)
As of 2016, eighty-six percent of the world’s population lives in a country with an ecological deficit. A country runs an ecological deficit when its residents demand more from nature than the country’s own ecosystems can regenerate. Seventy-one percent of the world’s population lives in a country with an ecological deficit and below world-average income, and therefore are unlikely to be able to buy their way out of the resource crunch.
Highlights of the new Footprint data and tools
- Last year, the United Nations’ persistent efforts to improve access to pertinent data resulted in shortening the delay in available data from three to two years. Not only did this change give researchers access to two years worth of data (2015, 2016) since last year’s edition, but this one-year gain in data availability delay brings the accurate assessment of countries’ Ecological Footprint and biocapacity that much closer to the current time, improving researchers’ ability to describe the recent reality and to assess current trends.
- The 2019 edition of the National Footprint and Biocapacity Accounts was produced, for the very first time, under the close observation of the team at York University’s Faculty of Environmental Studies (FES) who is part of the Ecological Footprint Initiative. Going forward, the Ecological Footprint Initiative team in Toronto will be entrusted with producing National Footprint and Biocapacity Accounts data with the support of Global Footprint Network, in the context of the partnership created in 2018 by both organizations with a view to ensuring ever more robust and transparent data in the future.
“Our faculty and students continue to appreciate and use global data on the Ecological Footprint and biocapacity of countries. These remain the best metrics for calculating human demand on the environment. We look forward to continuing the important work of producing the National Footprint and Biocapacity Accounts and leading a global research network committed to its application by policy-makers and the public.” —DR. ALICE J. HOVORKA, Dean & Professor of the Faculty of Environmental Studies at York University
Some country trends worth watching
All the results shown in this section reflect the perspective of a country’s consumption. This perspective tracks what is produced within the country plus the Footprint of trade (imports minus exports).
Venezuela
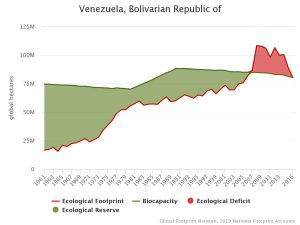
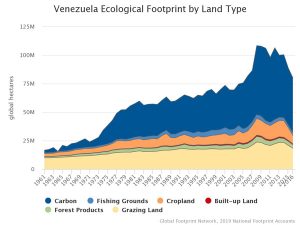
Venezuela’s total Ecological Footprint dropped 20 percent between 2014 and 2016, reflecting the dramatic deterioration of the country’s economy over the same period. The largest driver is the 50 percent decrease of the national cropland Footprint, due to a 58 percent collapse in Ecological Footprint of imports of agricultural products and a whopping 34 percent decline in local agricultural output. The carbon Footprint closely follows behind with a 12.8 percent decrease caused by the severe economic recession. Overall, the Ecological Footprint and GDP trends are closely aligned in this case. Rampant inflation began in 2015. By 2016, President Maduro declared economic emergency.
United Kingdom
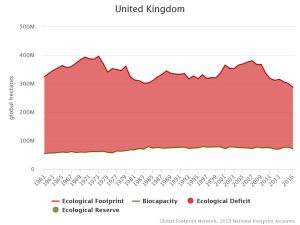
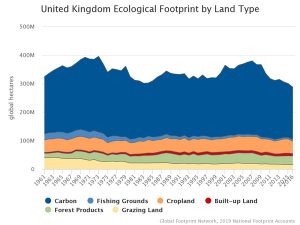
The United Kingdom’s carbon Footprint dropped 11.7 percent between 2014 and 2016, driving the country’s total Ecological Footprint down 8.8 percent. The U.K.’s total carbon Footprint has decreased by 29 percent since its 2007 peak and by around 26 percent since 1990, faster than any other major high-income country. These trends continue into 2017, largely driven by a significant decline in coal use, according to Carbon Brief: “The most significant factors include a cleaner electricity mix based on gas and renewables instead of coal, as well as falling demand for energy across homes, businesses and industry.” Remarkably, the U.K. is one of 19 countries to have significantly lowered their fossil fuel emissions over the past decade without decreasing their GDP. The “decoupling” of GDP and Ecological Footprint is certainly a hot trend to watch for the in the years to come.
On a different note, lower crop yields in 2016 cause the cropland Footprint of the U.K. to decline by 13 percent. According to the U.K.’s farming statistics, wheat and barley yields dropped 12 percent and 11 percent respectively after a couple of years of peak performance but they remain in line with longer term averages. Meanwhile, blackgrass and other weeds, poor drainage and disease caused oilseed rape yields to drop 21 percent.
Europe
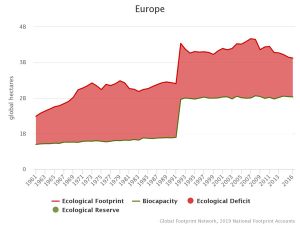
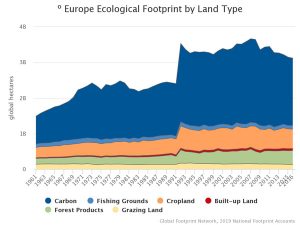
Many countries in Europe, including France and Germany, are showing a trend in decoupling of GDP and Ecological Footprint that echoes the trend in the U.K.. Europe’s carbon Footprint, which contributes to 60 percent of the region’s total Ecological Footprint, has decreased by 21 percent since 2007, including 3.7 percent between 2014 and 2016. This decline has been a major driver is drawing Europe’s Ecological Footprint down by 15 percent over the same period, lowering the ecological deficit by about 34 percent. Europe still uses 35 percent more goods and services from nature than its own natural ecosystems can renew.
Note that from 1991 on, the Europe region data set includes the breakaway countries from former Yugoslavia, the Baltic States, Belarus, Moldova, and Russia.
United States
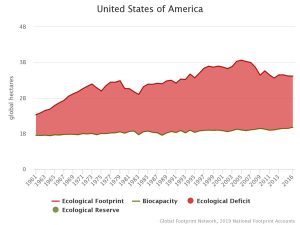
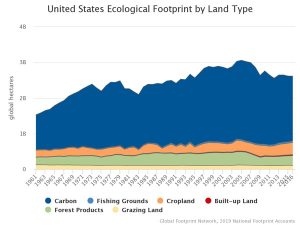
The USA’s total Ecological Footprint has decreased over the past decade, largely driven by an 18 percent decrease in its carbon Footprint between 2005 and 2016. This is due to competition from natural gas and renewables, which have displaced coal-fired power as a cheaper option for electricity production. However, this trend was reversed in 2017 and 2018, according to more recent US data that the National Footprint Accounts will start taking into account in its next edition as 2017 U.N. data is made available. America’s carbon dioxide emissions rose by 3.4 percent in 2018, the biggest increase in eight years. Colder winters in the Northeast have spiked the use of oil and gas for heating. Hotter summers around the country have increased power usage for cooling, boosting emissions. Other factors include a boost in manufacturing and a relative expansion of the national economy, leading to higher emissions from factories, trucks and air travel. The U.S. has yet to find its path toward decoupling its carbon Footprint from economic growth.
Russia
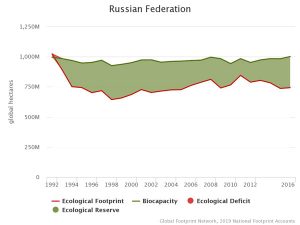
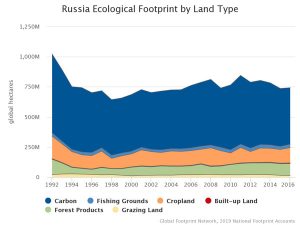
The continuous 12 percent slide of Russia’s Ecological Footprint since 2011 has mainly been driven by the 18 percent decrease of its carbon Footprint. Rather than a “decoupling” phenomenon between GDP growth and lower carbon emissions, however, this decrease reflects the economic difficulties that Russia struggled with over that period. Factors include the continued downward momentum of oil prices since their 2012 peak, and the sanctions imposed by the United States, the 28-nation European Union, Norway, Canada, and Australia in retaliation for Russia’s interference in Ukraine. The weak ruble and changes in state support programs which make beef imports too expensive for most potential buyers in Russia, compounded in 2014 by Russia’s retaliatory ban on food products from those same countries, including meat, are reflected in the 38 percent drop of the grazing Footprint between 2012 and 2016.
Russia has also enjoyed a 51 percent growth of its total cropland biocapacity (+50 percent per person) since its momentous 2012 grain harvest failure due to the exceptional drought in its Eastern agricultural regions. While expanding farmland areas account for 3 percent of this increase (or 1.58 million global hectares), improved yields make up the rest. Since 2011, Russia has grown its total ecological reserve by 85 percent (86 percent per person) despite losing 1.6 percent of its forest biocapacity over the same period.
China
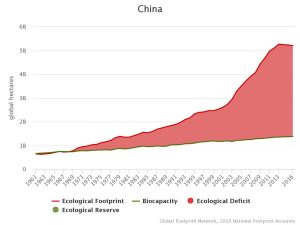
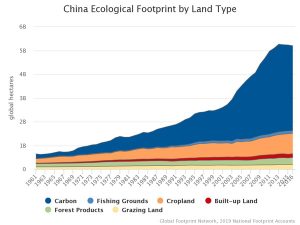
Unlike European countries, China’s total carbon Footprint soared in the post economic recession era. It increased by 39 percent from 2007 to 2014, reaching its peak in 2014. Since then, it has decreased by 2 percent thanks to a significantly reduced use of coal. From 2014 to 2016, expanded renewable and nuclear power generation was able to cover the slow growth in overall electricity consumption, according to Carbon Brief. This led to a slight decline in coal-fired power generation. However, 2017 and 2018 energy data point to a trend reversal. Electricity demand grew so fast in those two recent years – driven by growth in heavy manufacturing as well as contributions from household use and the service sector – that new low-carbon sources could not keep up. According to the Global Carbon Project, emissions grew by 2.3 percent from 2017 to 2018 due to more coal consumption for electricity production.
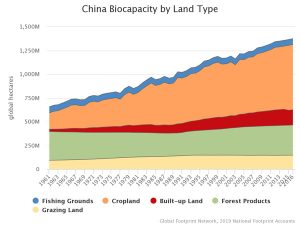
Since 2004, China, not unlike Russia, has grown its total cropland biocapacity by a whopping 19.3 percent (20 percent per person) – including 3.5 percent between 2014 and 2016 alone – increasing total biocapacity by 13 percent over the same period. Much of this upward trend is due to policies and government spending designed to improve agricultural sciences and practices in order to improve crop yield stability and performance, fending off the specter of feeding a large population from a relatively small area of available farmland. In addition, China has been expanding its total forested land by 32 percent since 1990.
Cuba
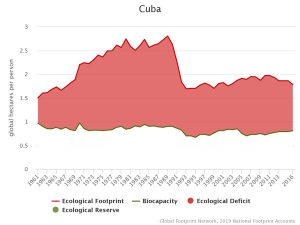
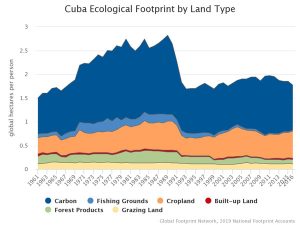
Cuba’s ecological deficit per person dropped 22.4 percent between 2010 and 2016, as its Ecological Footprint per person decreased by 10 percent and its biocapacity per person grew by 13 percent. The 23 percent decrease in the carbon Footprint per person is the main driver of the Ecological Footprint’s slide. Whether this trend continues hinges on the country’s commitment, in line with the Paris Climate Agreement, to generate 24 percent of its power from renewable sources by 2030. Cuba’s new Constitution, which was approved by referendum in February 2019, includes amendments directing Cuba to “promote the conservation of the environment and the fight against climate change, which threatens the survival of the human species.”
Between 2010 and 2016, Cuba increased its biocapacity per person by 13 percent (or 15 percent total) thanks to a 9 percent expansion of its total forested areas and a 28 percent boost of its total cropland biocapacity. The latter was made possible through agricultural transformation policies and programs designed, since 2007, to increase the country’s agricultural food self-sufficiency and biofuels capacity, reduce its dependence on imports, and possibly boost exports. However, the trend is expected to register a severe slow down, if not a halt, past 2016 due to extreme weather events, including Hurricane Irma in 2017, and the impact of the Venezuelan crisis on the Cuban economy.
For additional information
Check out our recent paper: Defying the Footprint Oracle: Implications of Country Resource Trends which focuses on lower-income countries. The article is based on the 2018 edition.
National Footprint and Biocapacity Accounts 2019 edition results will inform Mathis Wackernagel and Bert Beyer’s upcoming book, Ecological Footprint: Managing Our Biocapacity Budget, available for presale.
More resources
Launch Event Livestream: youtu.be/egcA0SXJFzA
Ecological Footprint Explorer Open Data Platform: data.footprintnetwork.org
Public Data package: www.footprintnetwork.org/public
Footprint Calculator: www.footprintcalculator.org
Country Work: www.footprintnetwork.org/countries
National Footprint Accounts Video: youtu.be/_T5M3MiPfW4