By Leo Wambersie, research associate, David Lin, Ph.D., chief science officer,
and Mathis Wackernagel, Ph.D., founder and president
The Ukraine invasion comes with heart-breaking human suffering. It will also impact people far away from the war as global supply chains for food and energy are crippled. The price shocks they cause may well lead to deadly consequences, particularly in lowest-income countries.
This dynamic is one of the latest examples of the challenges highlighted in our research on “The importance of resource security for poverty eradication.” The Russian Federation and Ukraine are biocapacity-rich countries. Ukraine contains 2.7 global hectares of biocapacity per person, of which, nearly two (1.9 global hectares per person) are cropland. This is about 4 times the world average. In contrast, the Russian Federation contains 6.7 global hectares of biocapacity per person, of which only 1 global hectare is cropland.
These data points are from 2018, the latest available in the National Footprint and Biocapacity Accounts 2022 edition. Here, we present a few key results on potential implications the war may have on resource security around the world.
Biological resources are becoming the materially limiting factor for economies, and the significance of this fact is underappreciated by many. As explained in this Nature paper, it is biological resources that ultimately also limit the use of fossil energy and most minerals and ores. Therefore, it is particularly relevant to highlight Ukraine’s biological resource situation, using Footprint and biocapacity data.
Let us present first a few key data points to set the scene: Ukraine’s Ecological Footprint and biocapacity in 2018 (figure 1).
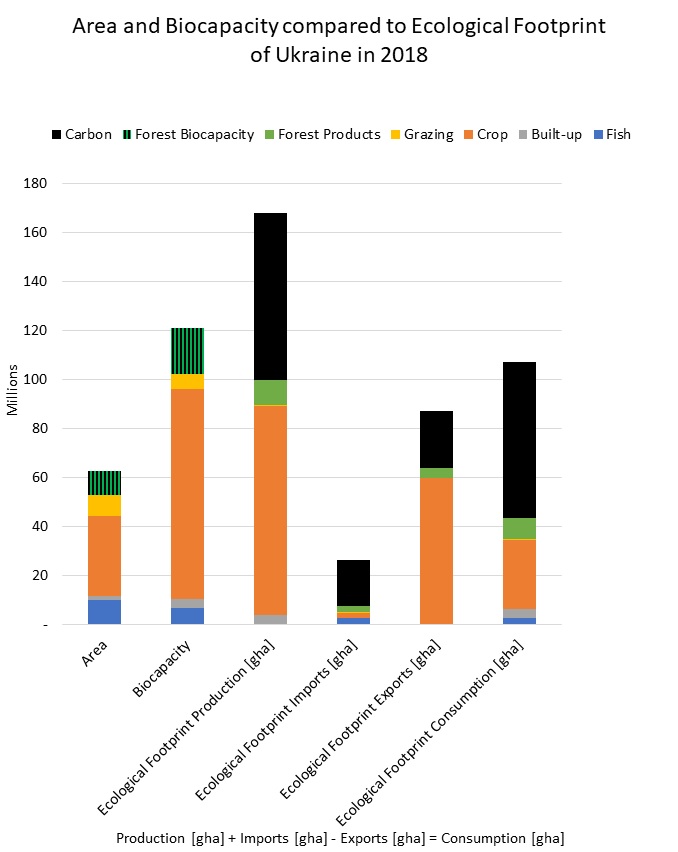
Figure 1: Ukraine’s Ecological Footprint and biocapacity (2018)
The two bars on the left of figure 1 show the biocapacity of Ukraine. The first column depicts the biologically productive area of Ukraine in unadjusted hectares: just over 60 million hectares. Since its land is nearly twice as productive as the world average, per hectare, Ukraine’s biocapacity in global hectares is nearly double its size in hectares. The four columns on the right in figure 1 show Ukraine’s Footprints. Among them, the production Footprint is the largest component. It represents the resources required to run the economy. In it, crop production stands out and carbon emissions, ie., the carbon Footprint of production, are also a large portion. The trade components show that Ukraine’s net exports, particularly of crop products, are high. Therefore, Ukraine’s consumption Footprint (the rightmost column in figure 1) is much lower than its production Footprint. For instance, its consumption crop Footprint is merely one third of its production crop Footprint, meaning that Ukraine only uses one third of its crops produced domestically.
Figure 2 shows the contribution of both Ukraine and the Russian Federation in producing and exporting crops. Both countries are among the top 10 producers and exporters of cropland biocapacity.
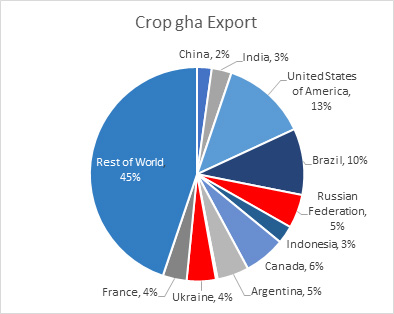
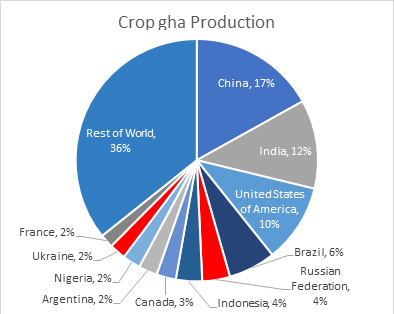
Figure 2: Ukraine and the Russian Federation’s position among top crop producers and exporters in the world (2018 data)
Using environmentally extended Multiregional Input-Output assessments (ee-MRIO), it is possible to determine the final destination of exports, i.e., where the crop goods grown in Ukraine, as well as all other products produced in Ukraine, are finally consumed. Such an analysis is needed as general trade statistics only report “first port of entry” of exports, not their final destination. Given long supply chains, final products often travel through several countries. Figure 3 a shows final destinations of crop products by country, figure 3b by region.
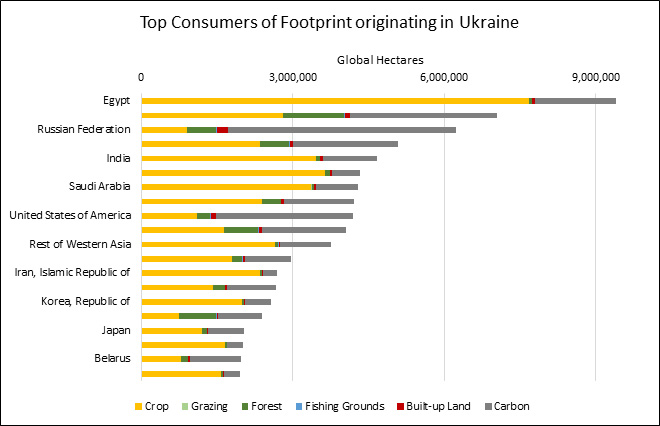
Figure 3a: Where products of Ukraine are finally consumed by country in global hectares (top 20 in 2018
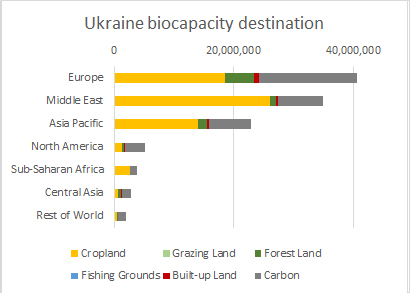
Figure 3b: Where products of Ukraine are finally consumed by region in global hectares (in 2018)
Cropland dominates Ukraine’s exports. For almost all the top consumers of Ukraine’s exports, cropland is the largest imported Footprint component from Ukraine. When measured in Ecological Footprints, Europe is the largest consumer of goods from Ukraine, followed by the Middle East. For crops, the Middle East is a larger consumer than Europe.
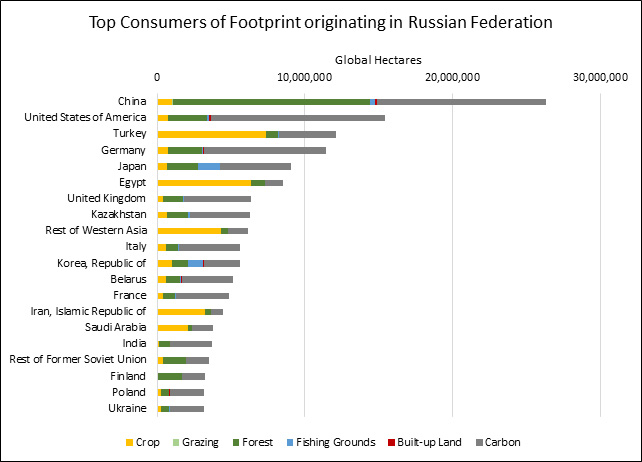
Figure 4a: Where products of the Russian Federation are finally consumed by country in global hectares (top 20 in 2018)
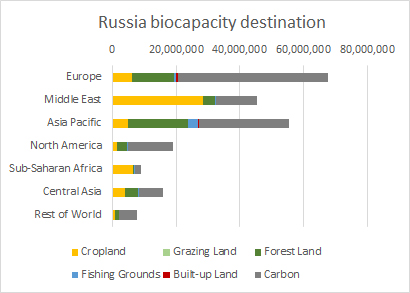
Figure 4b: Where products of the Russian Federation are finally consumed by region in global hectares (2018)
The Footprint originating in the Russian Federation is much more varied as shown in Figures 4a and 4b, including major forest products consumed in China, and embedded carbon Footprint consumed in China and the USA. Interestingly, the Middle East is a major destination of cropland from the Russian Federation as well.
Using the ee-MRIO results, we can focus on the “Wheat and Cereals” sector of Ukraine and the Russian Federation (figure 5).
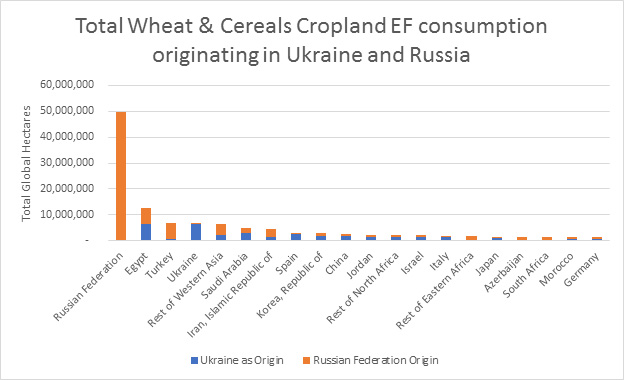
Figure 5: Where Ukrainian and Russian wheat and cereals are finally consumed (in global hectares, 2018)
It is no surprise that most of the “wheat and cereals” production from the Russian Federation is consumed in the Russian Federation – and the same holds true for Ukraine. Egypt and Turkey, however, are large destinations of “wheat and cereal” that originated from both Ukraine and the Russian Federation.
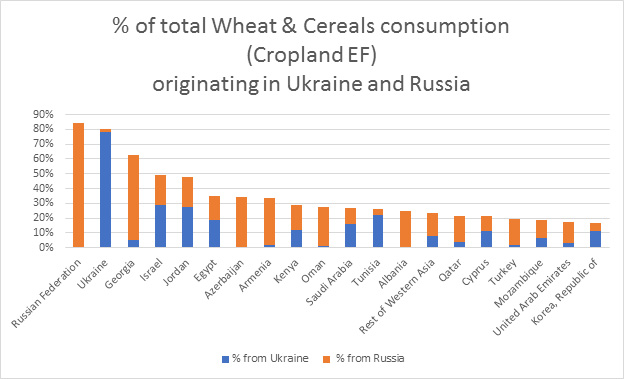
Figure 6: Proportion of Ukrainian and Russian wheat and cereals in overall demand for wheat and cereals (in percent, 2018)
Even more revealing is the proportion of wheat and cereal consumed that originates from the Russian Federation and Ukraine. Aside from the source countries themselves, which we would expect to be the top consumers as well, the other top countries on this list are nearby neighbor Georgia, and several MENA countries. In Tunisia, the country where the Arab Spring started in 2011, nearly one quarter of its consumed cereals and wheat originated in Ukraine.
How can we interpret statistics like “over 60% of ‘wheat and cereals’ consumed in Georgia originates from Ukraine and the Russian Federation”? Does this mean that Georgia is irrevocably dependent on Ukraine and the Russian Federation? Looking at resource accounting data, as provided here, offers some insights. But it also brings up more relevant questions to consider when analyzing a country’s resource dependency and determining associated risks. For instance, do these countries have price- competitive alternatives to Ukrainian crops? Given a lower level of price elasticity of basic food, could this significantly affect market prices, or even outprice large number of people from accessing basic calories? How will global markets and production systems all over the world adjust in the short and long term?
Once we recognize how significant resource security is, these numbers help us answer some basic questions and formulate even more relevant ones.